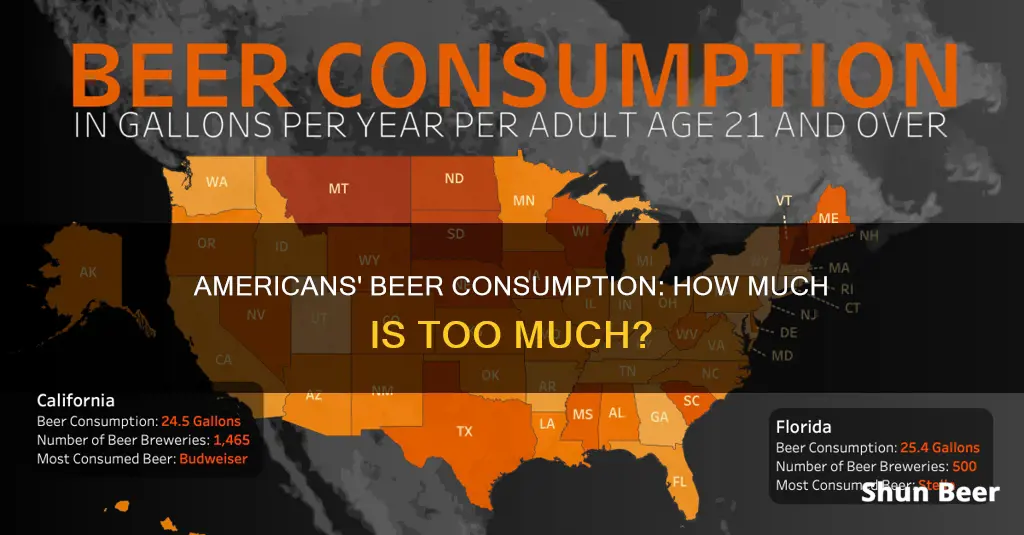
Beer is America's preferred alcoholic drink, with 39% of drinkers choosing it over wine or spirits. In 2018, Americans consumed an estimated 6.3 billion gallons of beer, or about 26.2 gallons per drinking-age adult. This amounts to approximately 494 drinks per year, 9.5 drinks per week, and 1.35 drinks per day. However, consumption patterns vary across the US, with some states having higher per-capita consumption than others. For instance, New Hampshire was the top-consuming state in 2020, with 41.5 gallons per capita, while Maryland consumed the least at 19.7 gallons.
What You'll Learn
![]()
Beer is the most popular alcoholic drink in the US
The popularity of beer in the US is further evidenced by the number of breweries in the country. As of 2020, there were over 9,000 breweries of different types, contributing to a $94.1 billion industry. Beer consumption also increased during the COVID-19 pandemic, with sales rising by 8.9% since 2020. This may be due to increased consumption or stockpiling, as people turned to alcohol as a coping mechanism during lockdowns and isolation.
While beer is the most popular alcoholic drink in the US, it is worth noting that wine and spirits also have their own dedicated followings. Wine is preferred by 31% of drinkers, while 27% choose liquor. Additionally, consumption patterns vary across different states and demographic subgroups. For example, New Hampshire was the top-consuming state in 2020, with 41.5 gallons of beer consumed annually per capita, while Maryland consumed the least at 19.7 gallons per capita.
Beer's dominance as the preferred alcoholic beverage in the US has been consistent over the years, although it was even more prominent in the 1990s when close to half of drinkers chose it as their preferred drink. Beer consumption in the US spans a wide range of demographics, with men, younger drinkers, and those in lower- and middle-income groups being the most likely to choose it as their drink of choice.
Birth Control and Beer: Is It Safe to Drink?
You may want to see also
![]()
Americans consumed 6.3 billion gallons of beer in 2018
Americans consumed an estimated 6.3 billion gallons of beer in 2018. This works out to be about 26.2 gallons per drinking-age adult, or roughly one six-pack per week. This figure is an average, and beer consumption patterns are not uniform across the US. Per capita consumption ranges from as little as 18.6 gallons to 40.8 gallons, depending on the state.
In 2022, the consumption of beer in the US amounted to approximately 2.82 million 2.25-gallon cases, a decrease of about one percent compared to the previous year. The number of beer brewing companies has continuously increased over the last decade, and the market is forecast to be valued at 145 billion dollars by 2027.
Beer is the favoured beverage among American drinkers, with 42% choosing beer, 34% choosing wine, and 19% enjoying liquor the most. The top 10% of American drinkers—24 million adults over the age of 18—consume, on average, 74 alcoholic drinks per week.
The states that drink the most beer per capita are New Hampshire, Montana, Vermont, and North Dakota. However, highly populated states such as California, Texas, and Florida top the list of states drinking the most beer overall.
Beer Gone Bad: Health Risks and Dangers of Drinking Sour Beer
You may want to see also
![]()
Consumption varies across states
Beer consumption varies significantly across different states in the US. While the overall consumption per adult over the age of 21 is around 28.2 gallons per person per year, or roughly one six-pack per week, this number is influenced by states with much higher and lower consumption.
New Hampshire came first in per capita consumption in 2020, with 41.5 gallons consumed annually per person. This high consumption is partly due to a lack of alcohol taxation, which attracts drinkers from neighbouring states. Montana and Vermont, which have many craft breweries, also made the top three, despite their small populations.
In contrast, Maryland consumed the least beer per capita in 2020, with only 19.7 gallons per person. This is less than half of New Hampshire's consumption.
When looking at total beer consumption, the most populous states naturally come out on top. California, the most populous state, consumed 795.2 million gallons of beer in 2021. Texas and Florida followed, with 655 million and 443.2 million gallons, respectively.
When broken down by region, the South consumed the most beer in 2021, with 2.5 billion gallons, while the Northeast drank the least, with approximately 1 billion gallons. However, on a per capita basis, the Midwest consumed the most, with 1.09 gallons of ethanol from beer per person.
These differences in consumption rates across states may be influenced by a variety of factors, including population size, alcohol taxation policies, and the number of craft breweries.
Beer Coolers: Understanding the Science of Cold
You may want to see also
![]()
Beer is the fifth most-consumed drink in the US
The average American consumes 494 alcoholic drinks per year, or 9.5 drinks per week. This is more than the NIAAA's recommended weekly alcohol intake for women, which is seven drinks per week. However, this average number of drinks consumed per week is lower than it was in 2019, when it was 4.0 drinks. This decrease in alcohol consumption may be due to the coronavirus pandemic, which prevented data collection in 2020 and may have impacted drinking habits.
There are differences in the types of alcoholic drinks that men and women prefer. Men are more than twice as likely as women to say they drink beer most often, while women are more than three times as likely as men to say that wine is their most common beverage. Beer is also more popular with younger drinkers, while wine is the preferred choice for older drinkers.
While beer is the most popular alcoholic drink in the US, there are disparities between different states. In 2020, New Hampshire was the top state for beer consumption, with 41.5 gallons consumed annually per capita. In contrast, Maryland consumed the least beer, with only 19.7 gallons consumed per capita.
Beer and Eliquis: Safe Mix?
You may want to see also
![]()
Beer sales increased during the pandemic
Beer sales in the US have been impacted by the COVID-19 pandemic in a variety of ways. While the beer industry as a whole has struggled, with breweries and beer bars facing closures due to the economic downturn, there has been an interesting discrepancy in the sales of different types of beer.
Craft breweries, in particular, have faced significant challenges during the pandemic, with many struggling to stay afloat as consumers have reduced their spending in bars, clubs, and restaurants. Local breweries have been hit hard by lockdowns, with untapped kegs leading to substantial losses. This has resulted in a shift towards store sales, with an overall increase in store beer sales of 27.5% compared to the previous year.
During the pandemic, consumers have shown a preference for ""sub-premium" beers, which are cheaper and have lower alcohol content. The sales of these beers had been gradually declining before the pandemic, but lockdowns and economic uncertainty seem to have driven people towards cheaper products. This trend is known as "premiumization" in the beer industry, and it has also benefited hard seltzers and craft beers, with White Claw sales, for example, increasing by 246.7%.
However, despite the increase in sales of cheaper beers, they are losing market share to craft beers and hard seltzers. The Brewers Association's chief economist, Bart Watson, noted that beer is relatively recession-resistant, and craft beer consumers tend to have disposable income, making it unlikely that they will switch to cheaper alternatives. Thus, expensive beer sales are not solely dependent on a thriving economy.
While the pandemic caused a shift in beer consumption patterns, with people drinking at home rather than in social venues, it also contributed to a broader decline in American beer consumption. In 2023, beer consumption in the US reached its lowest point since 1999, and craft beer sales declined by 1%. This can be attributed to changing consumer habits, rising costs, and a general correction in the market after a period of rapid growth in the late 2010s.
In summary, the COVID-19 pandemic disrupted the beer industry, with a mix of positive and negative impacts. While overall beer sales increased, the pandemic accelerated the decline of craft breweries and shifted consumption patterns towards at-home drinking. These changes, coupled with broader economic trends, contributed to a historic low in American beer consumption in 2023.
Morning Beer: Should You Drink Before Work?
You may want to see also
Frequently asked questions
The average American consumes 494 drinks per year, or 26.2 gallons per drinking-age adult.
Beer is the most popular alcoholic drink in the US, with 39% of drinkers preferring it. Wine is the next most popular drink at 31%, followed by liquor at 27%.
Beer consumption varies across the US, with per-capita consumption ranging from 18.6 gallons to 40.8 gallons depending on the state. New Hampshire is the top-consuming state, with 41.5 gallons consumed per capita in 2020.